
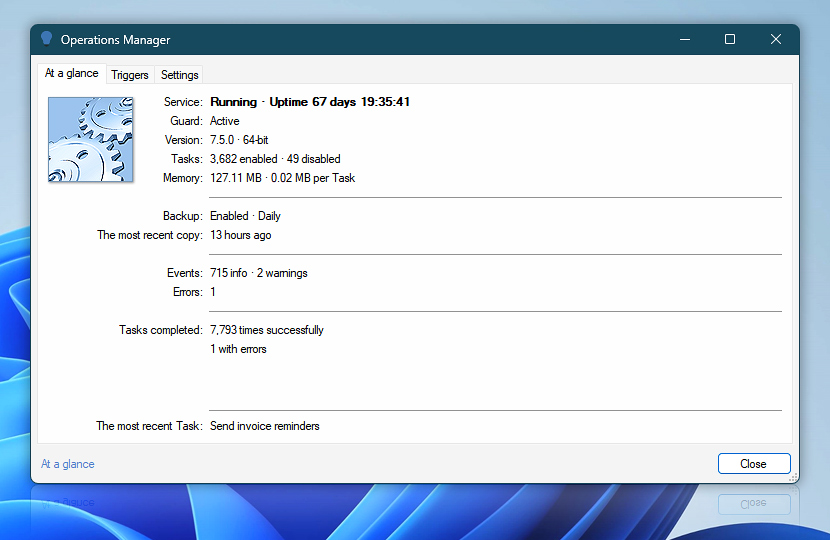
At a glance tab of Automation Workshop Operations Manager shows the most essential data on Task execution. The user can take a quick look and see whether the application is working normally or experiencing abnormal error rates. Various information on software version, number of enabled Tasks, memory use, and other parameters is displayed as well.
| At a glance | Details |
|---|---|
| Service | Shows whether the Automation Workshop Service is running and its current uptime. |
| Guard | Shows the status of Automation Workshop Service Guard which provides the extra safety measures for uninterrupted system availability. |
| Version | Displays Automation Workshop version and whether it is 32-bit or 64-bit. |
| Tasks | Indicates the number of enabled and disabled tasks. |
| Memory | Shows the system memory usage (both in MB and bytes) by Automation Workshop and Tasks. Total and per Task memory usage is shown. |
| Backup | Shows whether the automated backup of Automation Workshop Tasks and Settings is enabled and how frequently it is performed. |
| The most recent copy | Shows when the last backup was created. |
| Events | Displays the number of information and warning events. Note that only information and warning events that are logged to main log file are counted. |
| Errors | Displays the number of errors. Note that only the error events that are logged to main log file are counted. |
| Tasks completed | Displays the total number of successfully completed Tasks as well the number of Tasks that have finished with error. |
| The most recent Task | Shows a name of the most recently completed Task. A complete list of the currently executing and just finished Tasks can be viewed in Queue Manager. To access a realtime queue list from your workflows, use the Internal Queue category of Variable Wizard. |
Remote…
Use the Remote Operations Manager to overview the Service and Guard status, Service version installed, Task count, memory usage, backups performance, and latest information about events from any remote Automation Workshop instance.
Questions?
If you have any questions, please do not hesitate to contact our support team.