
Triggers and Actions UI for Processes & Apps helps you choose the right application or process by examining its properties such as path, executable, and memory usage. The information is updated in real-time like in Windows Task Manager.
Process info
With Automation Workshop, you can quickly view detailed information about running processes and services, including their location, memory usage, and other important metrics. This information helps you identify the correct app or background process to be selected and used in your automated workflow.
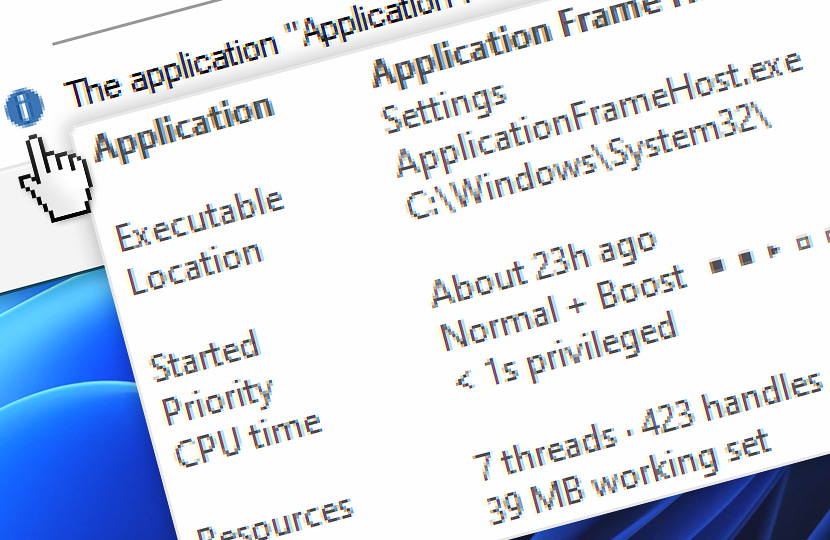
The extended details tooltip includes important app metrics, for example, the process start time, its priority, thread and handle count, as well as, CPU and memory usage.
Details…
A summary of key properties for applications and processes. The infoblock provides a comprehensive list of details and examples, which are listed below.
| Item | Details |
|---|---|
| Application | A display name of an application or background process (if the app developer has provided one). Optionally, a title from the main window of the app is shown:
|
| Executable | Name of an executable file for the app or process:
|
| Location | Full path to the location of the executable. For kernel drivers, filesystem drivers, and Windows subsystem for Linux (aka WSL) processes, a Windows NT device namespace path is shown instead:
|
| Process ID | If the application currently is not running (it has been recently closed), a process identifier (PID) is shown instead:
|
| Started | Time in minutes, hours, or days since the application or process was launched:
|
| Priority | App or process priority and information whether a priority boost is enabled:
|
| CPU time | How much time the app or process has spent in the user space and kernel space (privileged):
|
| Resources | How many handles the app has opened, and how many threads it has created. Also, how many DLL modules are loaded:
|
| Memory | How much memory the application and process is using:
|
Note
Depending on Windows configuration and the app/process is being observed, some information may not be shown in the tooltip. For example, the System Idle Process is not a real process and its memory and other metrics are not shown.
When viewing information about Windows Service processes you can view additional information in the extended service information tooltip.
Trigger
Actions
- Terminate App · Overview
- Tweak App · Overview
- App Information · Overview
- List Apps · Overview
- If App · Overview
- Wait for App · Overview
Still have a question?
If you have any questions, please do not hesitate to contact our support team.